
2012: A Close Race, With a High Degree of Uncertainty
Published Nov. 6, 2012 • Read time: 13m
Join the Conversation
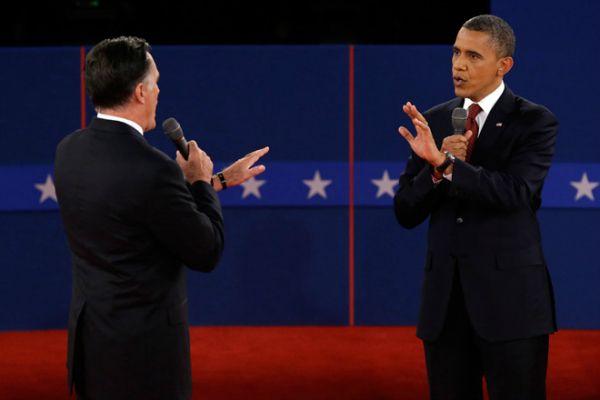
0Though it's always tempting to draw historical analogies between elections, each contest is invariably unique. This year is no exception. We have an incumbent president -- who also happens to be the nation's first African-American to hold that office -- facing the electorate in challenging economic circumstances. He is trailing his opponent with independent voters and on many of the issues that voters say they care most about, yet on Election Day his approval rating is right up against the 50 percent mark and he maintains a slight edge in the polls.
As a political analyst, this election is also unique in that it’s the country’s first true “data-driven” election. I mean two things by that; first, that statistics-based political analysis has become a booming cottage industry over the last four years. We now have more “data junkies” providing often thought-provoking analysis than ever before. In fact, as someone who began his writing career attempting to apply a more rigorous approach to political analysis, I can honestly say we're probably at the point where a course correction is necessary the other way.
The second thing I mean about this being a “data driven” election is that, unlike the five previous elections I’ve covered closely, as we sit here on Election Day we still have multiple data points to evaluate. Remember, data is the plural form of datum. Usually by this point in an election, we don’t have data; things have converged to form a single datum, which you don’t have to squint very hard to see.
Lies, Assault and Cover-ups Don't Stop Donald Trump
Trump Stands by His Man; Obama on a Health Scourge; Hayden Interview; Reagan's Courage
Analysis: For Trump, Few Limits to Win-At-Any-Cost Approach
What If Clinton Isn't Indicted?
For example, in 2008 some of the state polls were off (about which more later), but the errors canceled each other out, as we’d expect. But the big picture was clear. Weighted by the number of votes cast in each state, the 2008 state polls projected that Obama would win the popular vote with 53.5 percent to McCain’s 46.4 percent. This was roughly the same projection as the national pollsters found, and indeed is roughly the same as the final total.
But this year, there is a divergence between what the state polls are seeing and what the national polls are seeing. Right now the RCP Average has Obama up 0.7 points. That’s probably a bit favorable to him: the median and mode for the distribution is a tie.
Compare this to what we see if we weight the various pollsters’ projections of each state’s vote by the number of votes cast in those states in 2008. Huffington Post/Pollster’s state projections collectively show Obama with a 2.4 percent lead, 538 shows him with a 2.1 percent lead, while Drew Linzer’s Votamatic projections say 2.7. RealClearPolitics shows a 1.8 percent lead for Obama. On average, the various state poll aggregation methods imply a 2.3 percent lead for the president.
As I noted last week, using this method negates the possibility that Romney is simply overperforming in the very red or very blue states. We have a reasonable amount of polling in very blue states such as California, New York, and Illinois; by building those data into our weighted averages, we would pick up on any such divergence.
Moreover, Obama presently leads by 2.8 points in the state most likely to give him electoral vote number 270 (Nevada, as his present lead in Ohio is statistically indistinguishable at 2.9 points). This represents a 2.1 point split between the state that would give him electoral vote 270 and the popular vote, and a 2.8 point split between that state and the median.
As I noted earlier, a split of more than a point between the margin in the state that gives electoral vote number 270 and the popular vote total is highly unlikely. A split of more than two points in a two-way race would be unprecedented. Going back 100 years, it has only happened twice: In the bizarre four-way race of 1948 and the three-way race of 1912 (even in that year, if you add together the two Republicans, the split is less than a point). My guess is you have to go back to 1876 to find a three-point split, and Republicans stole that election (technically, they stole it back after Democrats stole it first by suppressing the black vote in the South).
So we can be reasonably certain that the split we’re seeing between state and national polling is “real.” As a final check, we can go through the various methods described above, and create PVIs, or Partisan Voting Indexes, for each state in the various methodologies. In other words, the states in RealClearPolitics’ averages imply a 1.8-point lead for Obama. Right now, Obama’s lead in Ohio is 2.9 points. The difference in spreads is about 1.2 points, which means Obama runs about 0.6 points ahead of the national average there. This is quite a bit more than the spread we see between the Ohio average and the mean/medians for the national vote.
If you do that for all of the swing states, using the varying methodologies, you get the following results:
On the right, I’ve included a PVI for Rasmussen Reports’ results, based off of the average he was showing for Romney at the time the poll was taken (usually Romney up by two). This isn’t to show any particular favor to Rasmussen; he’s just a prolific pollster who has polls in both the RCP state and national averages. On the far right we see the Cook PVI for the state, and the standard deviation (a measure of how much variation we see in numbers) for the four major methods.
Each of the cumulative state poll estimates are seeing the same basic thing in terms of where each individual state lands. The states also match up roughly to the Cook PVI for the state, as does Rasmussen’s polling. The only difference in the “topline” numbers you see displayed on the site is how the states, taken as a whole, see the national environment shaping up.
Most importantly, all of the methods see the swing states falling within a point of the national vote margin. Again, this is just another piece of evidence that state pollsters and national pollsters are seeing two different things. And there’s no ready way to reconcile the two.
So when you say “I believe the polls,” you don’t really. You’re inherently preferring one set of polls over the other -- usually the state polls. This is defensible, and it is the approach that Votamatic and Sam Wang’s model take. Huffington Post/Pollster and FiveThirtyEight implicitly rely upon the state polls heavily, although they use the national polls to sort of “fill in the blanks” on underpolled states and as a slight reality check on state polling.
But which set of polls should we rely upon?
Nate Silver has calculated that since 1992, the first year that we had ample state polling, the national polls had a severe bias twice: 1996 and 2000. The latter is, appropriately, disputable, given that the national polls swung hard toward Gore at the end after the Bush D.U.I. story broke. The very last national polls were correct.
In 1992, the state polls were off. In 2004 and 2008, our most recent elections, the polls were pretty good overall. The track record is therefore two years where both were good, one where the state polls were bad, one where the national polls were bad, and one where the national polls were only good at the very end.
That’s not a particularly decisive track record, and we have a very small number of case studies.
Moreover, we should recall that polling failures are actually quite common at the state level. They tend to cancel each other out in the aggregate, but they exist. Silver compiled final state poll averages going back to 1988. I count 22 instances where the final state polls were off by 2.9 points or more, out of 79 polls. That’s about one in four state polling averages being off by at least as much as Ohio would have to be in order for Romney to win.
In swing states, the RCP Averages were off by 2.9 points in 2008 alone in four states: Arizona (5.3 percent), Iowa (3.4 percent), New Mexico (3.8 percent), and Nevada (2.9 percent). In other words, a poll failure in a handful of critical states would not be all that surprising. Combined with evidence of systematic errors in both state and national polls over time, the track records seem about even.
But perhaps the most important factor is this: We have a new set of state pollsters. Consider Ohio. Of the pollsters who were there in 2004, only a few have returned to offer a final poll: The Columbus Dispatch, the Ohio Poll, Rasmussen and SurveyUSA. We see similar effects in other states, making measurements of the track records difficult. At the same time, almost all of the pollsters we have in the national polls were taking polls nationally in 2004, allowing for a true comparison.
So which should we rely on? The easy answer is that the state polls offer more observations, and they would therefore seem to be a better option, since more polls would have to be off for there to be a tight race. Two factors militate against this. First, a handful of pollsters dominate state polling: Rasmussen, PPP, ARG, Purple Strategies, We Ask America, Gravis Marketing, Survey USA, and a few others. While there might be more state polls, there aren’t really more state pollsters.
Second, and most importantly, the state polls have been showing fairly strong “house effects.” Remember, polling is not really the random exercise that exists in a stats lab. Pollsters get the raw data, which is almost always grossly unrepresentative of the population due to low response rates. Pollsters use a variety of proprietary formulas to engage in a game of 5-dimensional chess, weighting the data by race, class, gender and other “hard” demographic variables.
Then, pollsters have to make assumptions about what turnout will look like and, most importantly, who is going to turn out. By the time all is said and done, a pollster’s assumptions can play as important a role in the result as the data; the randomness of the draw is diminished.
The end result this cycle has been that we’ve seen two sets of polls at the state level, as Jay Cost described here. In Ohio, this has manifested in a cluster around a four-to-five-point Obama lead, and a cluster around a one-point Obama lead. Of the 20 polls with start dates in the last two weeks, only two have shown Obama up by three. This should be the most common result in an average of random draws. Instead, we see more pollsters showing Obama up one and as many showing a tie; we see more pollsters with Obama up five.
Most of the states have this “bimodal” distribution, for lack of a better word. This almost certainly is a result of house effects, as we consistently see the same pollsters turn in results showing tight races or Romney ahead, and the same pollsters with big Obama leads. This shouldn’t happen by random chance; if it were truly random some pollsters would show Romney close in some draws, big Obama leads in others and, most importantly, a lot of results at the median.
How do we resolve this? Well, let’s say that you say the U.S. capital is Washington, D.C. I say it is New York City. We could compromise and find a point halfway between. This would minimize the chances of an outlier, but it would also minimize the chances that you were correct -- in fact, it would guarantee you were wrong. Far better to consult historical sources, and discover that the capital moved from New York City in 1790.
When I look at the broader picture, I see a few things that suggest the national polls have a better view of things. First, and perhaps most importantly, the polls showing closer state races are consistent with the national polls, which almost all show a close race. This gives us an opportunity to resolve the two data sets somewhat.
Second, in four of the past five elections, the national polls and generic ballot for Congress have lined up almost perfectly, reflecting the decline in crossover voting. Most analysts see no change in Congress’ makeup, which would suggest a generic vote edge of three to four points nationally (there’s almost always a drop-off in the national vote after a wave, even if it doesn’t result in a loss of seats, and the party holding the House almost always overperforms the actual generic ballot polling). The national presidential polls are more consistent with this scenario.
Third, and this is perhaps more of a gut check than anything, I simply am more familiar with the national pollsters, who have decent track records and who are all well-funded enough to conduct the 20,000 or so interviews you need to get a sample of 1,000 likely voters. Indeed, if the state polls are wrong, I suspect this will be the culprit: Opening the likely voter screens too wide to account for the enthusiasm gap we’re seeing in the polls.
That said, I think putting all the eggs in the “national poll” basket would replicate the mistake of the methods that more or less go all-in on the state polls. Let’s look at it this way. Right now, the state RCP Averages forecast about a 75 percent chance of Obama winning. The national polls have it closer to 50-50, although with most methods predicting that Ohio’s PVI will be slightly Democratic, it’s probably more like a 55 percent chance that Obama wins.
If you assign, say, a 70 to 80 percent chance that the national polls are correct, that still translates to about a 60 percent chance that Obama will win. That’s a lot less than most of the other oddsmakers are giving right now, but it’s about how I see things.
So my final sense of things is offered with a reasonably high degree of uncertainty. I think that the popular vote will be close, and that Romney will win North Carolina, Florida, Virginia and Colorado, bringing him just shy of what he needs to win. But I think that Virginia, Colorado, New Hampshire, Iowa and Ohio will be very close, probably around a point each. It wouldn’t take a particularly large error in the national polls for Romney to win these states, however. And all it would take for this thing to turn into a healthy Obama win would be for little Marist polling to outshine Gallup.

Jon Finer’s Old and Dangerous ‘New Approach’ to Israel
Peter Berkowitz • RealClearPolitics
The President Deserves Better
John Ullyot • RealClearPolitics
Congress Doesn’t Need Another Blame Game. It Needs To Find What’s Broken
Jarrod Bernstein • RealClearPolitics
Democrats Won the Midterms. Common Sense Won, Too
Jordanne Kemper • RealClearPolitics
The 120th Congress Shapes Up
Carolina Lumetta • RealClearPolitics
Flooding GOP Primaries With Democrats
Robert Natelson • RealClearPolitics
RCP Today
Top stories on RealClearPolitics
The Takeaway
Polling intelligence and analysis delivered to your inbox
World News
Featuring the latest world news
Policy
Featuring the latest policy news
Support Our Mission
As part of RealClearPolitics, authors aim to provide balanced, non-partisan analysis by presenting top reporting and commentary from all sides of the political spectrum.
Trusted by policymakers and citizens alike since 2000